Macroexpand the Mind

Graffiti - a Python Library for Declarative Computation

Today I’m very excited to announce the release of graffiti, a Python library for declarative graph computation. To get going with graffiti, you can either install from PyPI via pip or checkout the source and install it directly:

1
2
3
4
5
6
7
# via pip install
pip install graffiti

# via github
git clone https://github.com/SegFaultAX/graffiti.git
cd graffiti/
python setup.py install

If you’d like to jump right in, the README has a brief introduction and tutorial. Also check out Prismatic’s Plumbing library which served as a huge source of inspiration for graffiti.

the problem

Consider the following probably entirely reasonable Python snippet:

1
2
3
4
5
6
7
8
9
10
11
12
13
14
15
16
def stats(xs):
  n = len(xs)
  m = float(sum(xs)) / n
  m2 = float(sum(x ** 2 for x in xs)) / n
  v = m2 - m ** 2

  return {
    "xs": xs,
    "n": n,
    "m": m,
    "m2": m2,
    "v": v,
  }

print stats(range(10))
#=> {'v': 8.25, 'xs': [0, 1, 2, 3, 4, 5, 6, 7, 8, 9], 'm2': 28.5, 'm': 4.5, 'n': 10}

This somewhat contrived example demonstrates two interesting ideas. First, it’s very common to build a computational “pipeline” by starting with some initial value (xs above) and pass it through a series of transformations to reach our desired result. Second, the intermediate values of that pipeline are often useful in their own right, even if they aren’t necessarily what we’re trying to calculate right now. Unfortunately the above example breaks down in a couple of key aspects, so let’s examine each of them in turn. Afterwards, I’ll show how to represent the above pipeline using graffiti and discuss how some of these pitfalls can be avoided.

One function to rule them all

The first obvious issue with our stats function is it’s doing everything. This might be perfectly reasonable and easy to understand when the number of things it’s doing is small and well-defined, but as the requirements change, this function will likely become increasingly brittle. As a first step, we might refactor the above code into the following smaller functions:

1
2
3
4
5
6
7
8
9
10
11
12
13
14
15
16
def mean(xs):
  return float(sum(xs)) / len(xs)

def mean_squared(xs):
  return float(sum(x ** 2 for x in xs)) / len(xs)

def variance(xs):
  return mean_squared(xs) - mean(xs) ** 2

def stats_redux(xs):
  return {
    "xs": xs,
    "m": mean(xs),
    "m2": mean_squared(xs),
    "v": variance(xs),
  }

Is this code an improvement over the original? On the one hand, we’ve pulled out a bunch of useful functions which we can reuse elsewhere, so that’s an obvious +1 for reusability. On the other hand, the stats_redux function is still singularly responsible for assembling the results of the other stats functions, making it into something of a “god function”. Furthermore, consider how many times sum and len are being called compared to the previous implementation. With the functions broken apart, we’ve lost the benefit of local reuse of those intermediate computations. For simple examples like the one above, this might be a worthwhile trade-off, but in a real application there could be vastly more time consuming operations where it would be useful to build on the intermediate results.

It’s also worth considering that in a more complex example the smaller functions might have more complex arguments putting a higher burden on the caller. For this reason it’s convenient to have a single (or small group of) functions like stats_redux to properly encode those constraints.

Eager vs. lazy evaluation

Another significant issue with the original stats function is the eagerness with which it evaluates. In other words, there isn’t an obvious way to compute only some of the keys. The simplest way to solve this problem is to break down the function as we did in the previous section, and then only manually compute the exact values as we need them. However, this solution comes with the same set of caveats as before:

  1. We lose local reuse of [potentially expensive to compute] intermediate values.
  2. It puts more burden on the user of the library, since they have to know and understand how to utilize the utility functions.

One possible approach to solving this problem is to manually encode the dependencies between the nodes to make it easier for the caller, but also allowing parts of the pipeline to be applied lazily:

1
2
3
4
5
6
7
8
9
10
11
12
13
14
15
16
17
18
19
20
21
def mean(xs):
  n = len(xs)
  return { "n": n, "m": float(sum(xs)) / n, "xs": xs }

def mean_squared(xs):
  md = mean(xs)
  md["m2"] = float(sum(x ** 2 for x in xs)) / md["n"]
  return md

def variance(xs):
  m2d = mean_squared(xs)
  m2d["v"] = m2d["m2"] - m2d["m"] ** 2
  return m2d

xs = range(10)
mean(xs)
#=> {'xs': [0, 1, 2, 3, 4, 5, 6, 7, 8, 9], 'm': 4.5, 'n': 10}
mean_squared(xs)
#=> {'xs': [0, 1, 2, 3, 4, 5, 6, 7, 8, 9], 'm2': 28.5, 'm': 4.5, 'n': 10}
variance(xs)
#=> {'v': 8.25, 'xs': [0, 1, 2, 3, 4, 5, 6, 7, 8, 9], 'm2': 28.5, 'm': 4.5, 'n': 10}

The above code might seem silly (because it is), but it solves the problem of eagerness by breaking the computation down into steps that build on eachother linearly. We also get reuse of intermediate values (such as len) essentially for free. The biggest issues with this approach are:

  1. It basically doesn’t work at all if the computational pipeline isn’t perfectly linear.
  2. It might require the caller to have some knowledge of the dependency graph.
  3. It doesn’t scale in general to things of arbitrary complexity.
  4. The steps aren’t as independently useful as they were in the previous section due to the incredibly high coupling between them.

When the source ain’t enough

The final issue I want to discuss with our (now beaten-down) stats function is that of transparency. In simple terms, it is extremely difficult to understand how xs is being threaded through the pipeline to arrive at a final result. From an outside perspective, we see data go in and we see new data come out, but we completely miss the relationships between those values. As our application grows in complexity (and it will), being able to easily visualize and reason about the interdependencies of each component becomes extraordinarily important. Unfortunately, all of that dependency information is hidden away inside the body of the function, which means we either have to rely on documentation (damned lies) or we have to read the source. Furthermore, reading the source is rarely the most efficient way to quickly get an intuition about what the code is actually trying to do.

Complexity [in software systems] grows at least as fast as the square of the size of the program

- Gerald Weinberg, Quality Software Management: Systems Thinking

In my experience, there isn’t a good general solution to this problem. Some applications reify certain kinds of dependencies in the type system. Others will use patterns like Dependency Injection or Inversion of Control to push dependency information into the application configuration or framework container. However, as the application tends towards complexity, these solutions can become just as brittle or pathologically difficult to understand as their imperative counter-parts.

graffiti to the rescue!

Here’s a quick recap of the issues we’ve identified so far about stats:

  1. It’s doing too much stuff, but we’d like to have a single (or small number) of functions responsible for building the results we want.
  2. It eagerly evaluates all of its results, but we’d like to be able to ask for some subset of those keys.
  3. It’s hard to see how the final dictionary/map is being generated and, in particular, what the dependencies between the different values are.
  4. Pulling it all apart has potential performance implications if intermediate values are computed multiple times.

Let’s rewrite stats to use graffiti:

1
2
3
4
5
6
7
8
9
10
11
12
from graffiti import Graph

stats_desc = {
  "n": lambda xs: len(xs),
  "m": lambda xs, n: float(sum(xs)) / n,
  "m2": lambda xs, n: float(sum(x ** 2 for x in xs)) / n,
  "v": lambda m, m2: m2 - m ** 2
}

graph = Graph(stats_desc)
graph(xs=range(10))
#=> {'v': 8.25, 'xs': [0, 1, 2, 3, 4, 5, 6, 7, 8, 9], 'm2': 28.5, 'm': 4.5, 'n': 10}

So what’s going on here? stats_desc is a “graph descriptor”, or in other words a description of the fundamental aspects of our computational pipeline. The Graph class accepts one of these descriptors (which is just a simple dict/map), and compiles it into a single function that accepts as arguments the root inputs (xs in this case), and then builds the rest of the graph according to the specification.

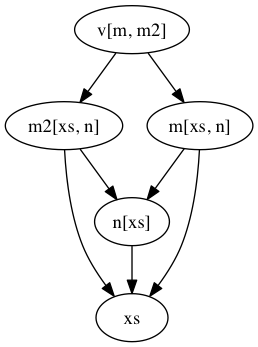
Ok, so this just seems like an obtuse way to represent the stats function. But because we’ve represented the pipeline as a graph, graffiti can do some incredibly useful operations. For example, you can visualize the graph:

1
2
# requires pydot: pip install pydot
graph.visualize()

Or we can ask it to partially evaluate the graph for only some of its keys:

1
2
graph(xs=range(10), _keys={"m2"})
#=> {'xs': [0, 1, 2, 3, 4, 5, 6, 7, 8, 9], 'm2': 28.5, 'n': 10}

We can even resume a previously partially computed graph:

1
2
3
prev = {'xs': [0, 1, 2, 3, 4, 5, 6, 7, 8, 9], 'm2': 28.5, 'n': 10}
graph(prev)
#=> {'v': 8.25, 'xs': [0, 1, 2, 3, 4, 5, 6, 7, 8, 9], 'm2': 28.5, 'm': 4.5, 'n': 10}

Graphs can be nested arbitrarily, provided there are no dependency cycles:

1
2
3
4
5
6
7
8
9
10
11
12
13
14
15
16
17
18
19
20
21
22
from collections import Counter

stats_desc = {
  "n": lambda xs: len(xs),
  "m": lambda xs, n: float(sum(xs)) / n,
  "m2": lambda xs, n: float(sum(x ** 2 for x in xs)) / n,
  "v": lambda m, m2: m2 - m ** 2,
  "avg": {
    "sorted": lambda xs: sorted(xs),
    "median": lambda sorted, n: sorted[n/2],
    "mode": lambda xs: Counter(xs).most_common()[0][0]
  }
}

graph = Graph(stats_desc)
graph(xs=[1, 2, 2, 3, 3, 3, 4, 4, 4, 4][::-1])
# {'avg': {'median': 3, 'mode': 4, 'sorted': [1, 2, 2, 3, 3, 3, 4, 4, 4, 4]},
#  'm': 3.0,
#  'm2': 10.0,
#  'n': 10,
#  'v': 1.0,
#  'xs': [4, 4, 4, 4, 3, 3, 3, 2, 2, 1]}

Graph descriptors are just normal dicts/maps, so non-dict/non-function values work normally:

1
2
3
4
5
6
7
8
9
desc = {
  "a": "Hello, world!",
  "b": [1, 2, 3, 4],
  "c": {"foo", "bar", "baz"}
}

graph = Graph(desc)
graph()
#=> {'a': 'Hello, world!', 'c': set(['bar', 'foo', 'baz']), 'b': [1, 2, 3, 4]}

Graphs can accept optional arguments:

1
2
3
4
5
6
7
8
9
10
desc = {
  "a": lambda xs, m=2: [x * m for x in xs]
}

graph = Graph(desc)
graph(xs=range(5))
#=> {'a': [0, 2, 4, 6, 8], 'xs': [0, 1, 2, 3, 4]}

graph(xs=range(5), m=10)
#=> {'a': [0, 10, 20, 30, 40], 'xs': [0, 1, 2, 3, 4], 'm': 10}

Lambdas in Python are quite limited as they are restricted to a single expression. Graffiti supports a decorator-based syntax to help ease the creation of more complex graphs:

1
2
3
4
5
6
7
8
9
10
11
12
13
14
15
16
17
18
19
20
21
22
23
24
25
26
27
28
29
30
graph = Graph()

@graph.node("len")
def length(xs):
  return len(xs)

@graph.node
def mean(xs, len):
  return float(sum(xs)) / len

graph.add_node("sorted", lambda xs: sorted(xs))

sub = graph.subgraph("avg")

@sub.node
def median(sorted, len):
  return sorted[len / 2]

graph(xs=range(10))
# {'avg': {'median': 5},
#  'len': 10,
#  'mean': 4.5,
#  'sorted': [0, 1, 2, 3, 4, 5, 6, 7, 8, 9],
#  'xs': [0, 1, 2, 3, 4, 5, 6, 7, 8, 9]}

graph.graph
# {'avg': <graffiti.Graph object at 0x101e96e50>,
#  'len': <function length at 0x101e996e0>,
#  'mean': <function mean at 0x101e998c0>,
#  'sorted': <function <lambda> at 0x101e99848>}

So how does this stack up to our stats function?

  1. Too much stuff –> each node is responsible for one aspect of the overall computational graph.
  2. Eager evaluation –> graffiti can partially apply as much of the graph as necessary, and you can incrementally resume a graph as more values are required.
  3. Hard to see dependencies –> graffiti’s powerful visualization tools give you an amazingly useful way to help gain an intuition about how data flows through the pipeline. Moreover, since the graph is just a dict, it’s easy to inspect it, play with it at the repl, build it up iteratively or across multiple files/namespaces, etc.
  4. Performance penalties from decoupling –> everything stays decoupled and intermediate values are shared throughout the graph. graffiti knows when not to evaluate keys if it already has done previously making graphs trivially resumable (see #2).

Hopefully some of these examples have demonstrated the power graffiti gives you over your computational pipeline. Importantly, since graph descriptors are just data (and the Graph class itself is just a wrapper around that data), you can do the same fundamental higher-order operations on them that you can normal dictionaries. And I’ve just started scratching the surface of what graffiti can do!

If you’re interested in helping out, send me a note SegFaultAX on Twitter and Github.

Analysis Paralysis

There are lots of things that can kill a project before it starts: lack of funding, lack of time, lack of specification, lack of applicable talent, the list goes on and on. Many of these problems can be alleviated with creative resource management and a bit of elbow grease. There is, however, a far more subtle mental phenomenon that can be as destructive to the creator as it is to the fledgling project:

Analysis paralysis or paralysis of analysis is the state of over-analyzing (or over-thinking) a situation so that a decision or action is never taken, in effect paralyzing the outcome. A decision can be treated as over-complicated, with too many detailed options, so that a choice is never made, rather than try something and change if a major problem arises. A person might be seeking the optimal or “perfect” solution upfront, and fear making any decision which could lead to erroneous results, when on the way to a better solution.

Source: Wikipedia – Analysis Paralysis

It’s incredibly easy to start second guessing every decision you’ve made (or are going to make) before you’ve made your first commit. In the early stages of any project, one has to consider all the possible options available that could be used to accomplish the task at hand and, from that list, choose just “the best” one. To be sure, decisions made at this stage can greatly affect the outcome of the project. But here’s the rub: none of this will matter if you never actually ship the project. It’s always preferable to pick a path that turns out to be wrong versus picking the path that leads to nothing at all.

So here’s my advice to anyone setting out on a new project:

Just pick something, anything, to get the ball rolling. Your requirements will change, there will be unplanned roadblocks, and that’s OK. Worry about those things as they come up, not before. And most of all, do not let your analysis paralysis get in the way of being useful!

Struggling With Technical Debt

Every company I’ve ever worked at has struggled with the concept of Technical Debt. If you’re not familiar with the term

Technical debt (also known as design debt or code debt) is a neologistic metaphor referring to the eventual consequences of poor or evolving software architecture and software development within a codebase.

Source: Wikipedia – Technical Debt

A “move fast and break things”-esque culture, can make it hard to take a step back and make sure the frankenhack you’ve created even qualifies as an MVP. When the pressure is on and product expected delivery yesterday, I think we all have a tendency to shutout that little voice in our head telling us to do it the Right Way ™. But at some point crunch time will end, and you’re left maintaining something that’s hardly passable as a product, much less a paramount of engineering prowess.

Process to the… rescue?

In my experience, processes like Scrum and XP serve to exacerbate rather than alleviate the problem if not managed carefully. Here’s how it usually goes:

  1. Start working on a [poorly scoped/written/sized/etc] story
  2. Discover something ugly that needs to be re-worked, but isn’t in the scope of your current story
  3. Write a fixit chore in your project tracker with a pithy title and high priority label
  4. Watch as that ticket is immediately prioritized under the “real” work by the product team

This pattern carries on ad infinitum until the aforementioned frankenhack buckles under its own complexity. Usually at this point someone utters the word “re-write”, much to the horror of everyone else in the company. Yes, we’re pushing out code at a break-neck pace, but at what cost? Would this level of flippancy about our craft be tolerated in any other engineering profession?

Dash of plot-thickening agent

Almost without fail, when the topic of technical debt comes up with product or businessy people around, someone presents this golden insight

Why don’t you just fix it as you see it?

There are at least two obvious reasons why this is deeply misguided at best, and positively destructive at worst. First, refactoring tends to be a recursive process with no clear base case. You might innocently start by ripping out a function or cleaning up the logic of some helper class, but then you have to track down all the tests for that bit of code. Oh, and while you’re at it, track down all the clients of that code which are hopefully well-factored already (unlikely) and tested in a way that doesn’t depend directly on the implementation of that thing you just rewrote (also unlikely). This process continues recursively until that one class or function you were refactoring turns into a multi-hundred line commit across tens of files.

The second problem is far more insidious at a process level. Ask yourself this question: do the above refactorings really fall under the scope of the current story? If the answer is no, then your 1 point story can easily turn into a 3 or 5 pointer in no time. (I’m using sizing jargon here loosely; translate the points to whatever unit of work your organization uses.) This high degree of churn can be absolutely demoralizing to a team that’s used to shipping on a regular basis. The high level of busy work without forward progress can create stress and burnout throughout the product and engineering teams.

Lights flicker in the distance

Many of these problems seem to compound and intensify as the engineering team grows. There are no silver bullets, and process alone isn’t going to get you very far (it might even drag you backwards along the path). This is a problem I reckon most engineering organizations struggle with and it is our duty as working professionals to come up with a viable long-term solution.

For the record, I don’t really know what that solution looks like, but here are some strategies I’ve used as both a manager and developer over the years with varying degrees of success:

  • Stop compromising so much! It’s your job to ship features, yes. It is also your job to give other stakeholders (product, bizdev, marketing, etc.) the appropriate feedback and transparency so they can properly scale their expectations. There is of course an implicit requirement here that those stakeholders actually care what you have to say. Without that, many organizations are doomed to failure before they have a chance at success.

  • Be noisy about debt. Don’t let those fixit stories sink into the backlog abyss. Product-focused processes like Scrum drive the development of user-facing features often at the cost of engineering discipline. Engineering should strive to push their priorities through with the same level of commitment and force as the other stakeholders.

  • Perfectionism != Debt-reducing. In my younger days, I was absolutely obsessed with perfection. Not to say everything I wrote was perfect (far from it), just that I spent an exorbitant amount of time thinking about the Right Way ™ to do something. In the end, especially when working in a group of more than 1 or 2 people, the outcome will be the same (or worse). You’ve spent so much time building a perfect house of cards, you can’t remember exactly how it all fits together. This is a classic example of optimizing for the wrong thing.

  • Set time aside on the roadmap. If all else fails, create “cleanup sprints”. These are usually 1 or 2 week sprints where the engineering team doesn’t build any new features and instead focuses on rebuilding existing code to meet higher quality standards. These sprints need to be carefully managed as they can easily turn into partial rewrites (often generating even more spaghetti code).

Especially in the start-up world, I think the problem of Technical Debt can easily reach crisis levels. In an environment when you’re already strapped for time and money, how can you possibly slow down to fix the things you’ve broken? There isn’t an easy solution, but we owe it to ourselves and our organizations to start the discussion today.

Learning to Blog by Blogging

I really have been meaning to start a blog for quite some time. Every couple of days I think of another idea for a post I’d love to write, a neat piece of code I’d love to share, or a fun little whatever I think is awesome. So why haven’t I done it until now you ask? I’ve gone through a large number of rationalizations, not the least of which are:

I don’t want to maintain it.

or

I don’t want to design and style it.

or even

I don’t want to waste time when I could be doing other things.

But these are just things I tell myself; little lies to keep my emotions in congruence with my actions. The real reason is far more simple: fear. I have an irrational fear of blogging.

I’m not afraid of rejection. Some people absolutely cannot stand it when others disagree with their opinion. Years of IRC and active forum usage have taught me that all opinions are controversial. Some people will hate you for no other reason than it’s in their very nature to do so.

I’m not afraid of public speaking. Blogging, in my mind, is this generation’s most common form of public speaking. But I present to groups on a regular basis, I’ve always been outspoken in academic and professional settings, and I love having open heated debates about whatever the topic du jour happens to be. I absolutely love leading the discussion and helping to drive people to new ideas or levels of understanding.

I’m not afraid of confrontation. Well in the physical sense I suppose I am, but that’s a different matter entirely. If programmers are known for anything, it’s their willingness to bikeshed incessantly about things that fundamentally do not matter. We are used to being the masters of our code and want to know something about everything. We yearn to feel important, especially amongst our peers.

Well ok, these are all lies. I’m human; it’s in my very nature to avoid sources of discomfort. But in reality, they pale in comparison to the most terrifying possibility of all: loneliness. What if I spend all this time pouring out my heart, only to be met with no audience at all. No hate mail, no dissent, no nothing. My words are just quiety ignored and swallowed into the infinite abyss of the Internet.

So I’ve made a decision: I’m writing these words for me. I’m writing them because I want to be a better writer. I’m writing them because I want to be better at expressing and communicating my thoughts and ideas. I’m writing them because my ideas matter. I’m writing them because I matter. I’m writing this because I want to contribute to the narrative of our generation.

The thoughts and ideas contained within this blog are a part of me. They are a small glimpse into my reality – my human experience.

This is my narrative, allow me to share it with you.